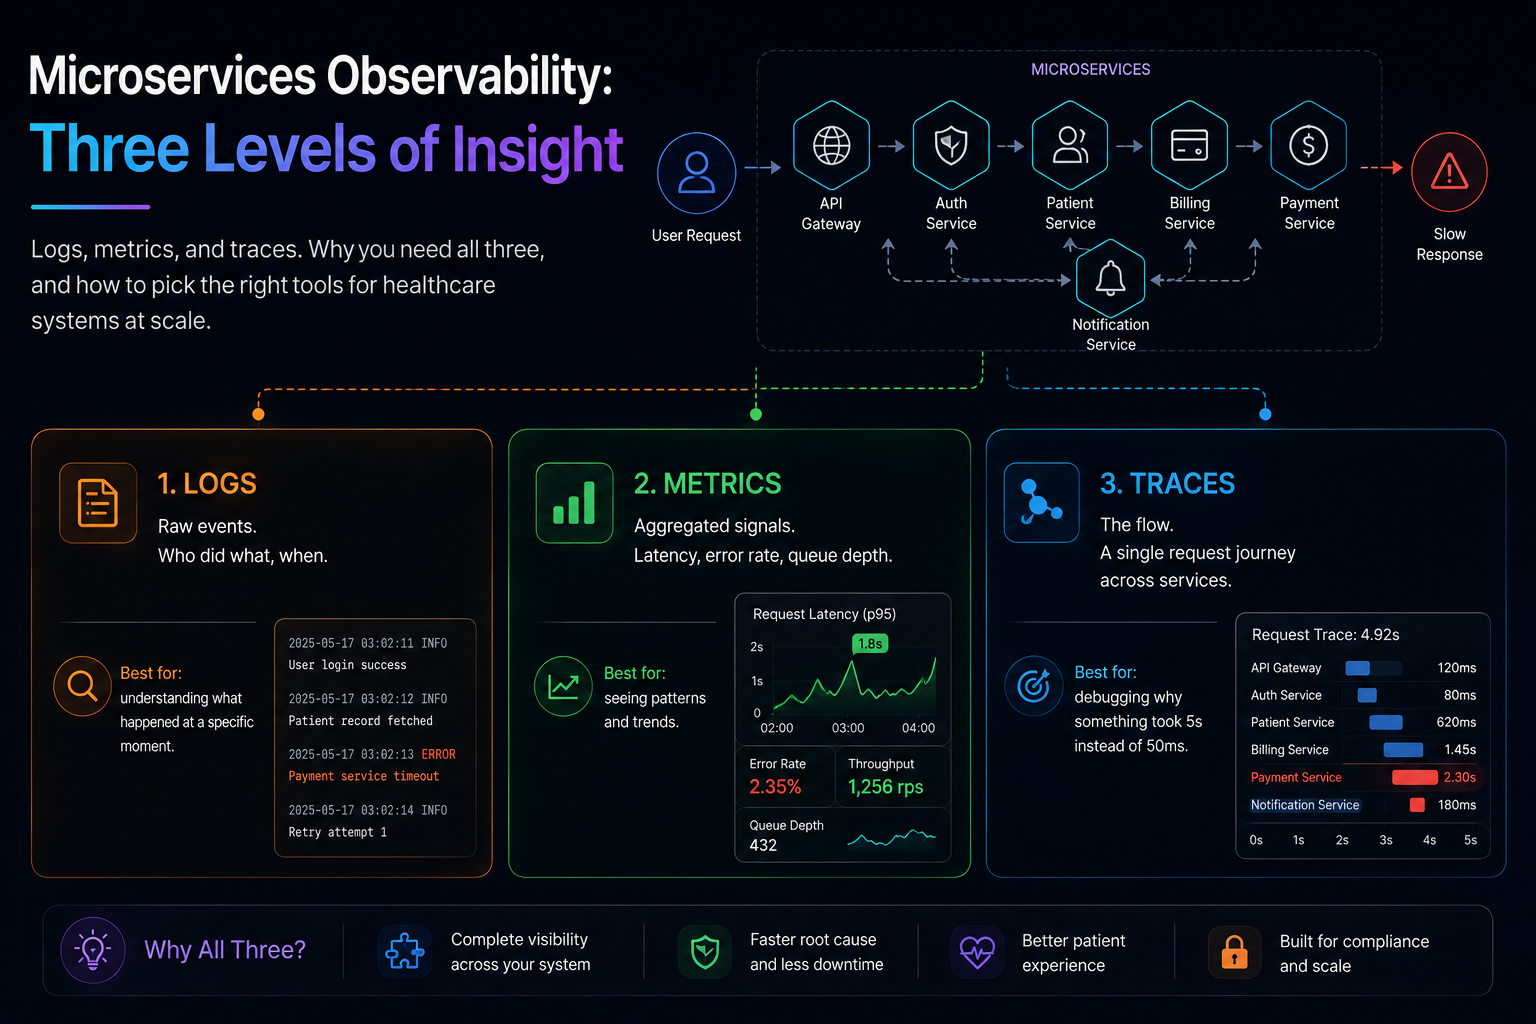
Microservices Observability: Three Levels of Insight
Logs, metrics, and traces. Why you need all three, and how to pick the right tools for healthcare systems at scale.
The Observability Problem
In a microservices architecture, a single user action can span ten services. When something breaks, logging alone will not cut it—you need to see the full context across boundaries.
Most teams start with logs. They are easy, cheap, and feel complete. Then at 3 AM, when a payment service is slow, you realize you cannot answer: Which service caused the delay? That is when you need metrics. Then you add traces, and suddenly the fog lifts.
The Three Pillars
1. Logs
Raw events. Who did what, when. Best for: understanding what happened at a specific moment.
2. Metrics
Aggregated signals. Request latency, error rate, queue depth. Best for: seeing patterns and trends.
3. Traces
The flow. A single request journey across services. Best for: debugging why something took 5 seconds instead of 50ms.
Practical Setup
For healthcare systems, I recommend:
- Structured logging (JSON) to cloud storage (S3/Blob) for compliance and audit
- Metrics to Prometheus-compatible backend (CloudWatch, DataDog) for real-time alerting
- Traces to OpenTelemetry + Jaeger or similar. Sample at 5-10% in production.
One last thing: correlation IDs are your friend. They tie logs, metrics, and traces together across service boundaries.